Student Achievement @WCC
The Southern Association of Colleges and Schools Commission on Colleges (SACSCOC) Principles of Accreditation, Standard 8.1 (Student Achievement) requires institutions to identify, evaluate, and publish goals and outcomes for student achievement appropriate to the institution's mission, the nature of the students it serves, and the kinds of programs offered. Institutions should use multiple measures to demonstrate achievement
Wytheville Community College Mission Statement
Dedicated to teaching excellence and student success, Wytheville Community College is an educational and community leader, providing lifelong career and personal growth, cultural enrichment, and economic advancement.
Student Achievement Criteria
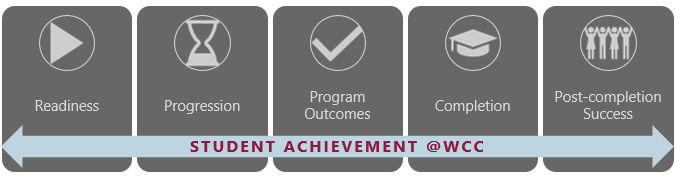
WCC’s five student achievement criteria are readiness, progression, program outcomes, completion, and post-completion success.
For each criterion, multiple measures for demonstrating student achievement, as well as thresholds of acceptability (i.e. benchmarked targets for performance) are described. Data are presented for multiple years and analyzed comparing WCC student achievement to designated benchmark targets.
In accordance with Standard 8.1, WCC selected the IPEDS (Integrated Postsecondary Education Data System) Graduation Rate Metric (see Completion Criterion, Measure 4.1) to satisfy SACSCOC requirements for disclosing students’ persistence to graduation. The IPEDS Graduation Rate Metric is calculated as the percentage of first-time, full-time degree or certificate-seeking students (from the fall cohort) completing a program within 150% of normal time. Graduate rate data are also disaggregated by gender, ethnicity/race, and socioeconomic status (using Pell grant recipient status) in Measure 4.2 using the IPEDS Graduation Rate Metric. Due to the small numbers of annual completers that occur as a result of disaggregating students into distinct groups, the disaggregated graduation rate data are presented as a four-year total in accordance with the Student Right-to-Know legislation.
CLICK HERE FOR THE MOST RECENT STUDENT ACHIEVEMENT GOALS AND OUTCOMES